 |
(9.81) |
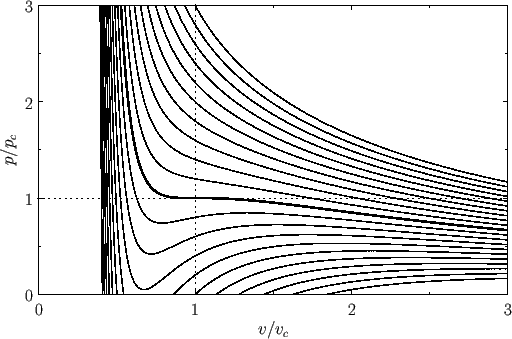 |
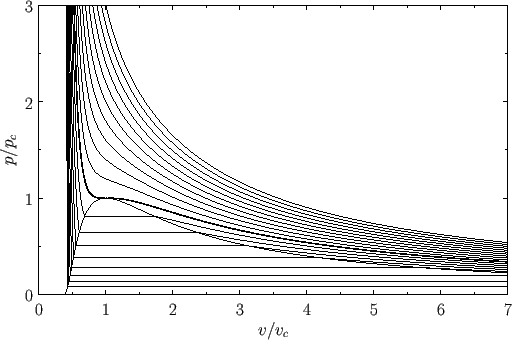
Figure 9.3 shows the isotherms of the van der Waals equation of state plotted in the ![]() -
-![]() plane. It can be seen that, for temperatures that
exceed the critical temperature (i.e.,
plane. It can be seen that, for temperatures that
exceed the critical temperature (i.e., ![]() ), reducing the molar volume of the fluid causes its pressure to rise monotonically, eventually becoming infinite
when
), reducing the molar volume of the fluid causes its pressure to rise monotonically, eventually becoming infinite
when ![]() (i.e., when the molecules are closely packed). On the other hand, for temperatures less than the critical temperature (i.e.,
(i.e., when the molecules are closely packed). On the other hand, for temperatures less than the critical temperature (i.e., ![]() ), as
), as ![]() is
decreased the pressure rises, falls, and then rises again, which seems to imply that, for some molar volumes, compressing the fluid can cause
its pressure to decrease. However, according to the analysis of Section 9.5, if a phase is such that compressing it causes its pressure to
decrease (i.e., if its isothermal compressibility is negative) then the phase is unstable to density fluctuations. Thus, below the critical temperature, the stable states on a given isotherm are divided into two groups.
The first group is characterized by relatively small molar volumes--these are liquid states. The second group is characterized by relatively
large molar volumes--these are gas states. The liquid and gas states are separated by a set of unstable states. Above the
critical temperature, the distinct liquid and gas states cease to exist--there is only a single stable fluid state. Consider the region of the
is
decreased the pressure rises, falls, and then rises again, which seems to imply that, for some molar volumes, compressing the fluid can cause
its pressure to decrease. However, according to the analysis of Section 9.5, if a phase is such that compressing it causes its pressure to
decrease (i.e., if its isothermal compressibility is negative) then the phase is unstable to density fluctuations. Thus, below the critical temperature, the stable states on a given isotherm are divided into two groups.
The first group is characterized by relatively small molar volumes--these are liquid states. The second group is characterized by relatively
large molar volumes--these are gas states. The liquid and gas states are separated by a set of unstable states. Above the
critical temperature, the distinct liquid and gas states cease to exist--there is only a single stable fluid state. Consider the region of the ![]() -
-![]() plane in which the states predicted by Equation (9.82) are unstable. It turns out that our analysis has broken down here because we assumed the
existence of a single phase, whereas, in fact, in this region of the
plane in which the states predicted by Equation (9.82) are unstable. It turns out that our analysis has broken down here because we assumed the
existence of a single phase, whereas, in fact, in this region of the ![]() -
-![]() plane, there exists a stable mixture of liquid and gas phases in equilibrium with one another. Let
us investigate further.
plane, there exists a stable mixture of liquid and gas phases in equilibrium with one another. Let
us investigate further.
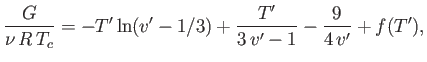
At a given temperature and pressure, the true equilibrium state of a system is that which minimizes the Gibbs free energy. (See Section 9.4.) For the case of a van der Waals fluid,
 |
(9.83) |
 |
(9.84) |
 |
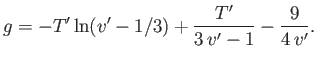
Figure 9.4 shows ![]() plotted as a function of
plotted as a function of ![]() for
for ![]() . Also shown is the corresponding isotherm
in the
. Also shown is the corresponding isotherm
in the ![]() -
-![]() plane. Although the van der Waals equation of state associates some pressures with more than
one molar volume, the thermodynamically stable state is that with the lowest Gibbs free energy. Thus, the triangular
loop in the graph of
plane. Although the van der Waals equation of state associates some pressures with more than
one molar volume, the thermodynamically stable state is that with the lowest Gibbs free energy. Thus, the triangular
loop in the graph of ![]() versus
versus ![]() (points 2-3-4-5-6) corresponds to unstable states. As the pressure is gradually increased, the
system will go straight from point 2 to point 6, with an abrupt reduction in molar volume. Of course, this corresponds to a gas-liquid phase transition. At intermediate molar volumes, the thermodynamically stable state is a mixture of gaseous and liquid phases at the transition pressure, as
illustrated by the straight-line in the
(points 2-3-4-5-6) corresponds to unstable states. As the pressure is gradually increased, the
system will go straight from point 2 to point 6, with an abrupt reduction in molar volume. Of course, this corresponds to a gas-liquid phase transition. At intermediate molar volumes, the thermodynamically stable state is a mixture of gaseous and liquid phases at the transition pressure, as
illustrated by the straight-line in the ![]() -
-![]() graph. The curved portion of the isotherm that is cut off by this straight-line
correctly indicates what the allowed states would be if the fluid were homogeneous. However, these homogeneous states are
unstable, because there is always another mixed state at the same pressure that possesses a lower Gibbs free energy.
graph. The curved portion of the isotherm that is cut off by this straight-line
correctly indicates what the allowed states would be if the fluid were homogeneous. However, these homogeneous states are
unstable, because there is always another mixed state at the same pressure that possesses a lower Gibbs free energy.
The pressure at the phase transition can easily be determined from the graph of ![]() versus
versus ![]() . However, it is also
possible to determine this pressure directly from the
. However, it is also
possible to determine this pressure directly from the ![]() -
-![]() isotherm. Note that the net change in
isotherm. Note that the net change in ![]() in going around
the triangular loop 2-3-4-5-6 in Figure 9.4 is zero. Hence,
in going around
the triangular loop 2-3-4-5-6 in Figure 9.4 is zero. Hence,
 |
(9.85) |
 |
(9.86) |
 |
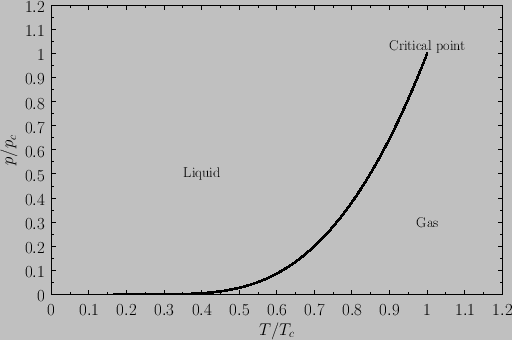
Repeating the Maxwell construction for a variety of temperatures yields the phase diagram shown in Figure 9.5. [See J. Lekner, Am. J. Phys. 50, 161 (1982)
for a practical method of implementing the Maxwell construction analytically. See, also, Exercise 7.] For each temperature, there is a well-defined pressure, known as the
vapor pressure, at which the liquid-gas transformation takes place. Plotting this pressure versus the temperature yields the phase diagram shown
in Figure 9.6. Note that the liquid-gas phase boundary disappears at the critical temperature (![]() ), because there is no phase transformation
above this temperature. The point at which the phase boundary disappears is called the critical point. The corresponding temperature,
pressure, and volume are known as the critical temperature, pressure, and volume, respectively.
At the critical point, the properties of the liquid and
gas phases become identical.
), because there is no phase transformation
above this temperature. The point at which the phase boundary disappears is called the critical point. The corresponding temperature,
pressure, and volume are known as the critical temperature, pressure, and volume, respectively.
At the critical point, the properties of the liquid and
gas phases become identical.
Consider a phase transformation at some temperature ![]() in which the gaseous phase has the molar volume
in which the gaseous phase has the molar volume ![]() , whereas
the liquid phase has the molar volume
, whereas
the liquid phase has the molar volume ![]() . Now, the molar entropy of a van der Waals gas can be written
. Now, the molar entropy of a van der Waals gas can be written
| (9.87) |
 |
(9.88) |
 |
(9.89) |
 |