


Next: Basins of Attraction
Up: The Chaotic Pendulum
Previous: Poincaré Section
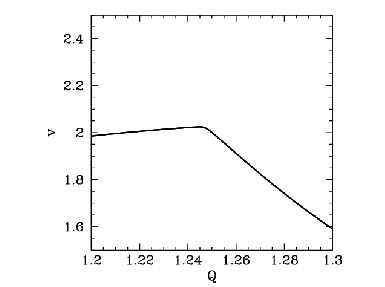
Figure 64:
The  -coordinate of the Poincaré section of a time-asymptotic orbit
plotted against the quality-factor
  . Data
calculated numerically for
 ,
,  ,
,  ,
,  , and
, and  .
.
 |
Suppose that we now gradually increase the quality-factor  . What happens to the
simple orbit shown in Figure 62? It turns out that, at first, nothing particularly exciting
happens. The size of the orbit gradually increases, indicating a corresponding increase in
the amplitude of the pendulum's motion, but the general nature of the motion remains unchanged.
However, something interesting does occur when
  is increased beyond about
  .
Figure 64 shows the
  -coordinate of the orbit's Poincaré section plotted
against
  in the range
  and
and  . Note the sharp downturn
in the curve at
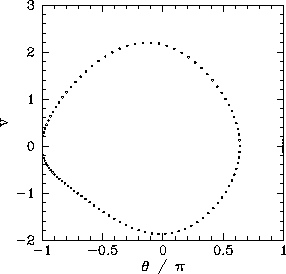
  . What does this signify? Well, Figure 65 shows
the time-asymptotic phase-space orbit just before the downturn (i.e.,
at
  ), and Figure 66 shows the orbit somewhat after the downturn
(i.e., at
  ). It is clear that the downturn is associated with a
sudden change in the nature of the pendulum's time-asymptotic phase-space orbit. Prior to the downturn, the orbit
spends as much time in the region
  as in the region
  . However,
after the downturn the orbit spends the majority of its time in the region
  .
In other words, after the downturn, the pendulum bob favours the region to the left of
the pendulum's vertical. This is somewhat surprising, since there is nothing in the
pendulum's equations of motion which differentiates between the regions to the left
and to the right of the vertical. We refer to a solution of this type--i.e., one which fails
to realize the full symmetry of the dynamical system in question--as a symmetry
breaking solution. In this case, because the particular symmetry which is broken is
a spatial symmetry, we refer to the process by which the symmetry breaking solution
suddenly appears, as the control parameter
  is adjusted, as spatial symmetry breaking.
Needless to say, spatial symmetry breaking is an intrinsically non-linear process--it
cannot take place in dynamical systems possessing linear equations of motion.
Figure 65:
Equally spaced (in time) points on a time-asymptotic orbit in phase-space.
Data calculated numerically for  ,
,  ,
,  ,
,  , and
, and
 .
.
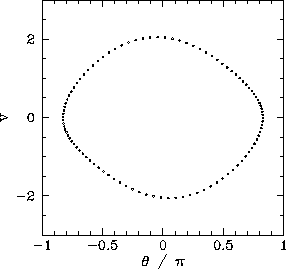 |
Figure 66:
Equally spaced (in time) points on a time-asymptotic orbit in phase-space.
Data calculated
numerically for  ,
,  ,
,  ,
,  , and
, and
 .
.
 |
It stands to reason that since the pendulum's equations of motion favour neither the
left nor the right then the left-favouring orbit pictured in Figure 66 must be accompanied
by a mirror image right-favouring orbit. How do we obtain this mirror image orbit?
It turns out that all we have to do is keep the physical parameters  ,
,  , and
, and  fixed, but change the initial conditions
  and
and  . Figure 67 shows
a time-asymptotic phase-space orbit calculated with the same physical parameters used in Figure 66, but
with the initial conditions
  and
and  , instead of
  and
and
 . It can be seen that the orbit is indeed the mirror image of that pictured in Figure 66.
Figure 67:
Equally spaced (in time) points on a time-asymptotic orbit in phase-space. Data
calculated numerically for  ,
,  ,
,  ,
,  , and
, and
 .
.
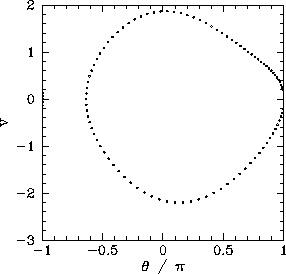 |
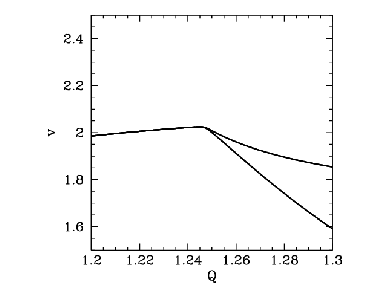
Figure 68 shows the  -coordinate of the Poincaré section of a time-asymptotic orbit,
calculated with the same physical parameters used in Figure 64, versus
 in the range
  and
and  . Data is shown for the two sets of
initial conditions discussed above. The figure is interpreted as
follows. When
  is less than a critical value,
which is about
  , then the two sets of initial conditions lead to motions
which converge on the same left-right symmetric
period-1 attractor. However, once
 exceeds the critical value then the attractor bifurcates into two
asymmetric mirror image period-1
attractors. Obviously, the bifurcation is indicated by the forking of the
curve shown in Figure 68. The lower and upper branches correspond to the left- and right-favouring
attractors, respectively.
Figure 68:
The  -coordinate of the Poincaré section of a time-asymptotic orbit
plotted against the quality-factor
  . Data
calculated numerically for
 , and
, and  . Data is shown for two sets of initial
conditions:
  and
and  (lower branch); and
  and
and  (upper branch).
 |
Spontaneous symmetry breaking, which is the fundamental non-linear process illustrated in the
above discussion, plays an
important role in many areas of physics. For instance, symmetry breaking gives mass
to elementary particles in the unified theory of electromagnetic and weak interactions.![[*]](footnote.png) Symmetry breaking also plays a pivotal role in the so-called ``inflation'' theory of the expansion
of the early universe.
Symmetry breaking also plays a pivotal role in the so-called ``inflation'' theory of the expansion
of the early universe.![[*]](footnote.png)


Next: Basins of Attraction
Up: The Chaotic Pendulum
Previous: Poincaré Section
Richard Fitzpatrick
2011-03-31


![]() ,
, ![]() , and
, and ![]() fixed, but change the initial conditions
fixed, but change the initial conditions ![]() and
and ![]() . Figure 67 shows
a time-asymptotic phase-space orbit calculated with the same physical parameters used in Figure 66, but
with the initial conditions
. Figure 67 shows
a time-asymptotic phase-space orbit calculated with the same physical parameters used in Figure 66, but
with the initial conditions ![]() and
and ![]() , instead of
, instead of ![]() and
and
![]() . It can be seen that the orbit is indeed the mirror image of that pictured in Figure 66.
. It can be seen that the orbit is indeed the mirror image of that pictured in Figure 66.

![]() -coordinate of the Poincaré section of a time-asymptotic orbit,
calculated with the same physical parameters used in Figure 64, versus
-coordinate of the Poincaré section of a time-asymptotic orbit,
calculated with the same physical parameters used in Figure 64, versus
![]() in the range
in the range ![]() and
and ![]() . Data is shown for the two sets of
initial conditions discussed above. The figure is interpreted as
follows. When
. Data is shown for the two sets of
initial conditions discussed above. The figure is interpreted as
follows. When ![]() is less than a critical value,
which is about
is less than a critical value,
which is about ![]() , then the two sets of initial conditions lead to motions
which converge on the same left-right symmetric
period-1 attractor. However, once
, then the two sets of initial conditions lead to motions
which converge on the same left-right symmetric
period-1 attractor. However, once
![]() exceeds the critical value then the attractor bifurcates into two
asymmetric mirror image period-1
attractors. Obviously, the bifurcation is indicated by the forking of the
curve shown in Figure 68. The lower and upper branches correspond to the left- and right-favouring
attractors, respectively.
exceeds the critical value then the attractor bifurcates into two
asymmetric mirror image period-1
attractors. Obviously, the bifurcation is indicated by the forking of the
curve shown in Figure 68. The lower and upper branches correspond to the left- and right-favouring
attractors, respectively.

![[*]](footnote.png) Symmetry breaking also plays a pivotal role in the so-called ``inflation'' theory of the expansion
of the early universe.
Symmetry breaking also plays a pivotal role in the so-called ``inflation'' theory of the expansion
of the early universe.![[*]](footnote.png)