Next: Free-fall under gravity
Up: Motion in 1 dimension
Previous: Motion with constant velocity
Motion with constant acceleration
Motion with constant acceleration occurs in everyday life whenever an
object is dropped: the object moves downward with the constant
acceleration
 , under the influence of gravity.
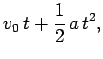
Fig. 8 shows the graphs of displacement versus time and
velocity versus time for a body
moving with constant acceleration. It can be seen that the displacement-time graph consists of
a curved-line whose gradient (slope) is increasing in time.
This line can be represented algebraically as
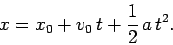 |
(19) |
Here,  is the displacement at time
  : this quantity can be determined from the
graph as the intercept of the
curved-line with the
: this quantity can be determined from the
graph as the intercept of the
curved-line with the  -axis. Likewise,
  is the body's instantaneous
velocity at time .
is the body's instantaneous
velocity at time .
Figure 8:
Graphs of displacement versus time and velocity versus time
for a body moving with constant acceleration
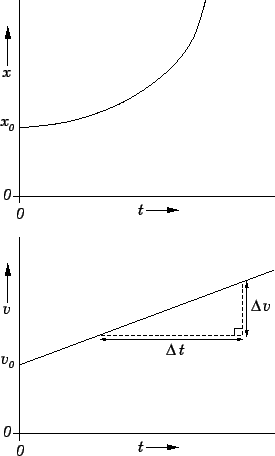 |
The velocity-time graph consists of a straight-line which can be represented
algebraically as
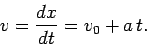 |
(20) |
The quantity is determined from the graph as the intercept of the
straight-line with the -axis. The quantity  is the constant acceleration: this
can be determined graphically as the gradient of the straight-line
(i.e., the ratio
is the constant acceleration: this
can be determined graphically as the gradient of the straight-line
(i.e., the ratio
 , as shown). Note that
 , as expected.
Equations (19) and (20) can be rearranged to give the
following set of three useful formulae which characterize motion with
constant acceleration:
Here,  is the net distance traveled after
  seconds.
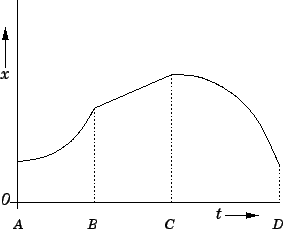
Fig. 9 shows a displacement versus time graph for a slightly more
complicated case of accelerated motion. The body in question accelerates
to the right [since the gradient (slope) of the graph is increasing in time]
between times  and
and  . The body then moves to
the right (since is increasing in time) with a constant velocity
(since the graph is a straight line) between times
and
. The body then moves to
the right (since is increasing in time) with a constant velocity
(since the graph is a straight line) between times
and  .
Finally, the body decelerates [since the gradient (slope) of the graph is decreasing in time]
between times and
.
Finally, the body decelerates [since the gradient (slope) of the graph is decreasing in time]
between times and  .
.
Figure 9:
Graph of displacement versus time
 |
Next: Free-fall under gravity
Up: Motion in 1 dimension
Previous: Motion with constant velocity
Richard Fitzpatrick
2006-02-02