Next: Worked example 2.2: Speed
Up: Motion in 1 dimension
Previous: Free-fall under gravity
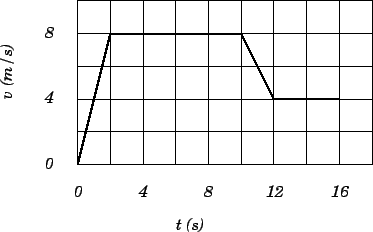
Question: Consider the motion of the object whose velocity-time
graph is given in the diagram.
- What is the acceleration of the object between times
 and
and  ?
?
- What is the acceleration of the object between times
 and
and  ?
?
- What is the net displacement of the object between times and
 ?
?
Answer:
- The
 -
- graph is a straight-line between and , indicating
constant acceleration during this time period. Hence,
graph is a straight-line between and , indicating
constant acceleration during this time period. Hence,
- The - graph is a straight-line between and , indicating
constant acceleration during this time period. Hence,
The negative sign indicates that the object is decelerating.
- Now,
 , so
, so
In other words, the net displacement between times and equals
the area under the - curve, evaluated between these two times. Recalling that the
area of a triangle is half its width times its height, the number of grid-squares
under the - curve is 25. The area of each grid-square is
 .
Hence,
.
Hence,
Next: Worked example 2.2: Speed
Up: Motion in 1 dimension
Previous: Free-fall under gravity
Richard Fitzpatrick
2006-02-02